Skip to content

PyMSM contains a few example datasets which can easily be loaded:
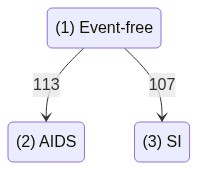
AID-SI¤

A simple 2 state competing risks dataset

From Data Analysis with Competing Risks and Intermediate States, by Ronald B. Geskus:

The data contains information on two event types, “AIDS” and “SI”, which compete to be the first to occur. Time is given in years since HIV infection. There are two different representations of the information on the event type that occurred first.
In the cause column, the event type is described in words, whereas in the status column a numeric respresentation is used.
The ccr5 column contains the information on the presence of the deletion CCR5-∆32. Individuals that don’t have the deletion have the value WW (W stands for “wild type”). Individuals that have the deletion on one of the chromosomes have the value WM (M stands for “mutation”)

See also: https://www.rdocumentation.org/packages/mstate/versions/0.3.1/topics/aidssi
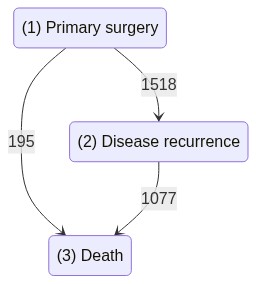
from pymsm.datasets import load_aidssi, prep_aidssi, plot_aidssi
data = load_aidssi()
data.head()
patnr time status cause ccr5
1 1 9.106 1 AIDS WW
2 2 11.039 0 event-free WM
3 3 2.234 1 AIDS WW
4 4 9.878 2 SI WM
5 5 3.819 1 AIDS WW
competing_risk_dataset, covariate_cols, state_labels = prep_aidssi(data)
competing_risk_dataset.head()
sample_id time_entry_to_origin origin_state target_state time_transition_to_target ccr5_WW
0 1 0 1 2 9.106 1
1 2 0 1 0 11.039 0
2 3 0 1 2 2.234 1
3 4 0 1 3 9.878 0
4 5 0 1 2 3.819 1
plot_aidssi(competing_risk_dataset, state_labels)

Rotterdam¤

A 3-state Illness-death dataset

The rotterdam data set includes 2982 primary breast cancers patients whose data records were included in the Rotterdam tumor bank. Patients were followed for a time ranging between 1 to 231 months (median 107 months), and outcomes were defined as disease recurrence or death from any cause.

This data includes 2982 patients, with 15 covariates, and was extracted from R survival package.
For more information see page 113 in https://cran.r-project.org/web/packages/survival/survival.pdf.
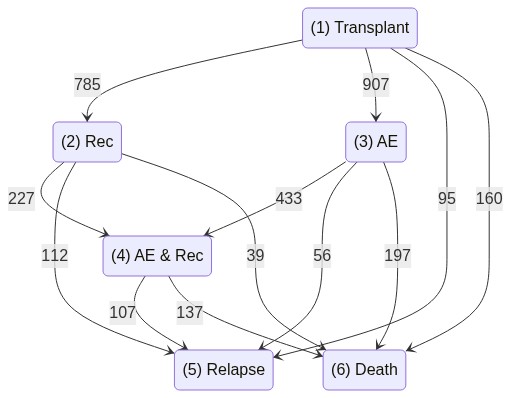
from pymsm.datasets import load_rotterdam, prep_rotterdam, plot_rotterdam
rotterdam = load_rotterdam()
rotterdam.head()
pid year age meno size grade nodes pgr er hormon chemo rtime recur dtime death
0 1 1992 74 1 <=20 3 0 35 291 0 0 1798.999948 0 1798.999948 0
1 2 1984 79 1 20-50 3 0 36 611 0 0 2828.000021 0 2828.000021 0
2 3 1983 44 0 <=20 2 0 138 0 0 0 6011.999804 0 6011.999804 0
3 4 1985 70 1 20-50 3 0 0 12 0 0 2623.999895 0 2623.999895 0
4 5 1983 75 1 <=20 3 0 260 409 0 0 4914.999997 0 4914.999997 0
dataset, state_labels = prep_rotterdam()
plot_rotterdam(dataset, state_labels)

EBMT¤

A Multi-state dataset

Data from the European Society for Blood and Marrow Transplantation (EBMT)

A data frame of 2279 patients transplanted at the EBMT between 1985 and 1998.
(from R mstate package, for more information see: https://www.rdocumentation.org/packages/mstate/versions/0.3.1/topics/EBMT%20data)

from pymsm.datasets import load_ebmt, prep_ebmt_long, plot_ebmt

load_ebmt().head()
id from to trans Tstart Tstop time status match proph year agecl
1 1 1 2 1 0.0 22.0 22.0 1 no gender mismatch no 1995-1998 20-40
2 1 1 3 2 0.0 22.0 22.0 0 no gender mismatch no 1995-1998 20-40
3 1 1 5 3 0.0 22.0 22.0 0 no gender mismatch no 1995-1998 20-40
4 1 1 6 4 0.0 22.0 22.0 0 no gender mismatch no 1995-1998 20-40
5 1 2 4 5 22.0 995.0 973.0 0 no gender mismatch no 1995-1998 20-40
competing_risk_dataset, covariate_cols, state_labels = prep_ebmt_long()
competing_risk_dataset.head()
sample_id origin_state target_state time_entry_to_origin time_transition_to_target match_no gender mismatch proph_yes year_1990-1994 year_1995-1998 agecl_<=20 agecl_>40
0 1 1 2 0.0 22.0 1 0 0 1 0 0
1 1 2 0 22.0 995.0 1 0 0 1 0 0
2 2 1 3 0.0 12.0 1 0 0 1 0 0
3 2 3 4 12.0 29.0 1 0 0 1 0 0
4 2 4 5 29.0 422.0 1 0 0 1 0 0
plot_ebmt(competing_risk_dataset, state_labels, covariate_cols, terminal_states=[5, 6])

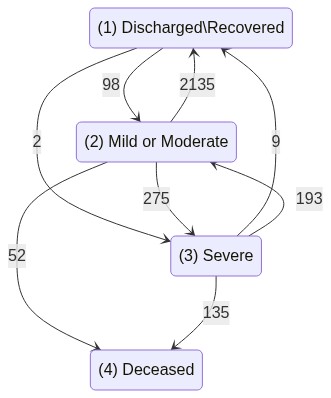
Covid hospitalizations in Israel¤

Complex multis-state, recurring events and time-varying covariates dataset
Israel COVID-19 hospitalization public data, as described in Roimi et. al. 2021.

from pymsm.datasets import prep_covid_hosp_data, plot_covid_hosp
dataset, state_labels = prep_covid_hosp_data()
plot_covid_hosp(dataset, state_labels)
100%|██████████| 2675/2675 [00:06<00:00, 426.53it/s]